Thorough analyses of the electroencephalography (EEG) following pharmacological administration or genetic manipulations requires careful determination of sleep/wake profiles. EEG power is significantly different during normal waking compared to normal non-rapid eye movement (NREM) and rapid eye movement (REM) sleep. EEG power analyses without accounting for state (wake, NREM and REM) is mostly uninterpretable since changes in spectral power density could simply be related to changes in the amounts of sleep/wake states.
PsychoGenics has deep knowledge of sleep/wake analyses and provides the highest quality EEG data. A full characterization of EEG patterns includes sleep/wake analyses, careful artifact removal for high quality power analyses, spectral power density analyses within each state, and a characterization of any aberrant EEG waveforms such as unusual spiking or seizure activity. These careful analyses provides the best opportunity for finding EEG biomarkers that are translational to the clinic. Below are example data on zolpidem, a standard sleep-promoting compound.
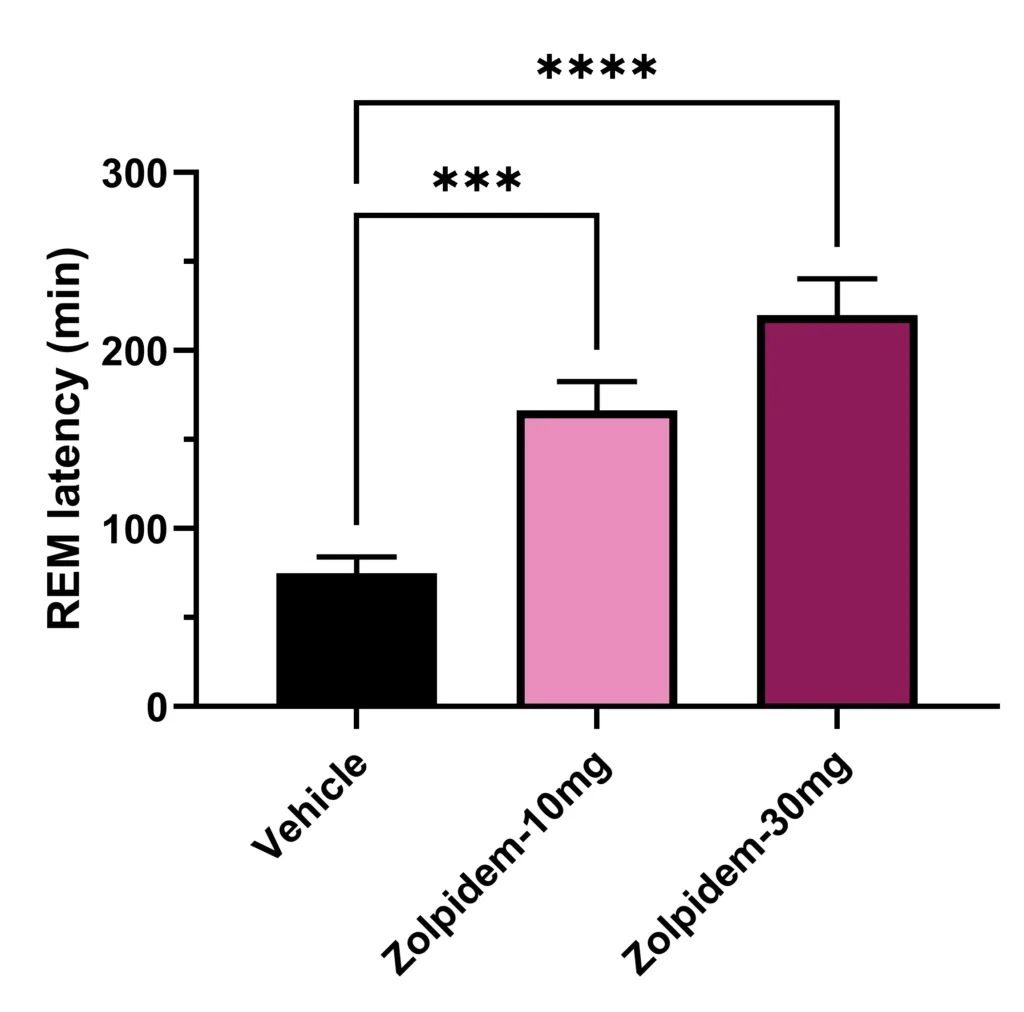
Figure 1. The effects of Zolpidem on the latency to the onset of NREM and REM sleep. Rats were administered Zolpidem (10 and 30 mg/kg) during dark phase (ZT17). Zolpidem decreased the onset to NREM and increased the latency to REM in a dose-related manner.
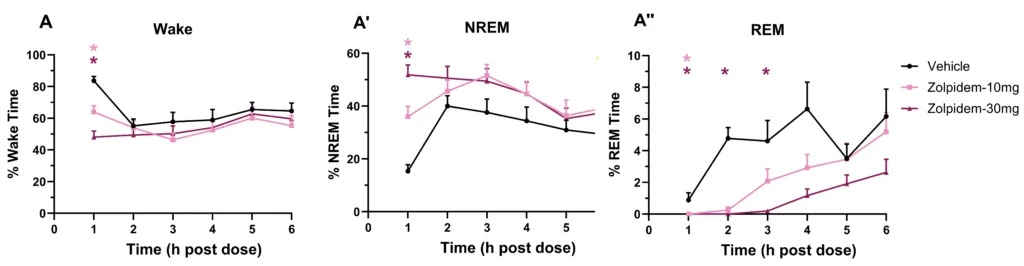
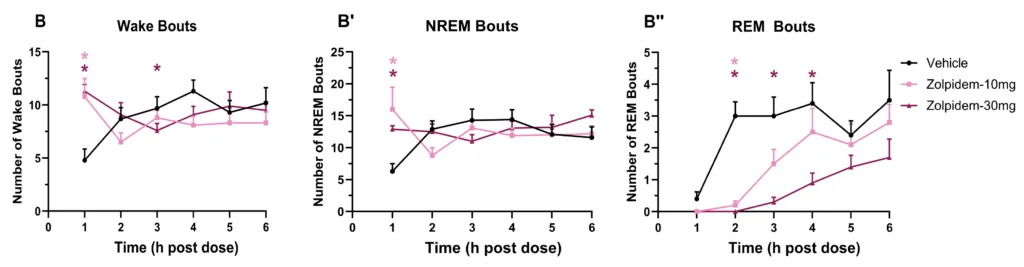
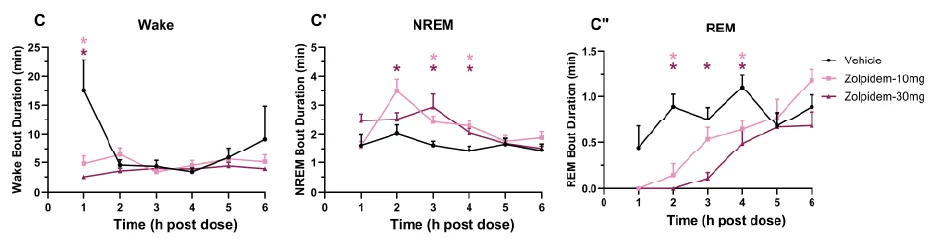
Figure 2. Hourly percent time (A, A’, A’’), average number of bout (B, B’, B’’) and average bout durations (C, C’, C’’) for Wake (left column), NREM (center column) and REM (right column) following Zolpidem (10 and 30 mg/kg) in rats (n=10). Zolpidem has a relatively short acting sleep promoting effect lasting only for the first hour post-dose (increased NREM, decreased Waking, increases in the number of Wake and NREM bouts, decreased Wake bout durations, and increased NREM bout durations). REM, however, is decreased for 3 h post dose (decreases in time in REM, in the number of bouts of REM and in the average bout duration). Also note that NREM is elevated throughout the recording which is primarily due to increased NREM bout durations (longer bouts of NREM).
Waking EEG Spectral Power
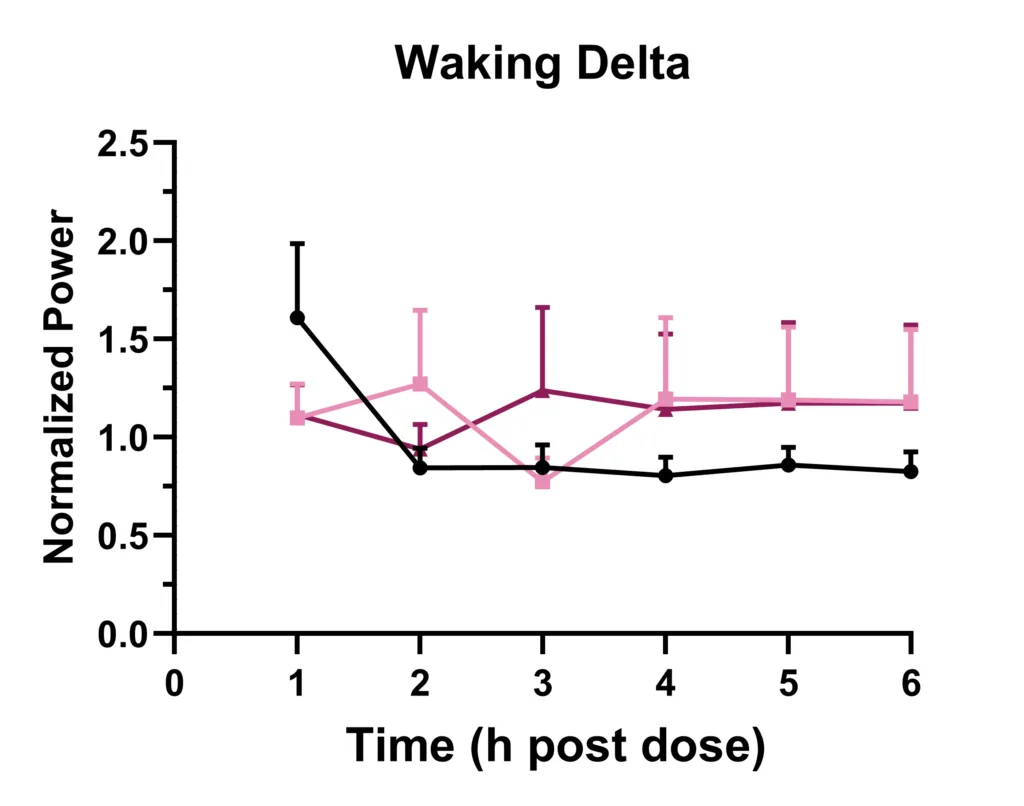
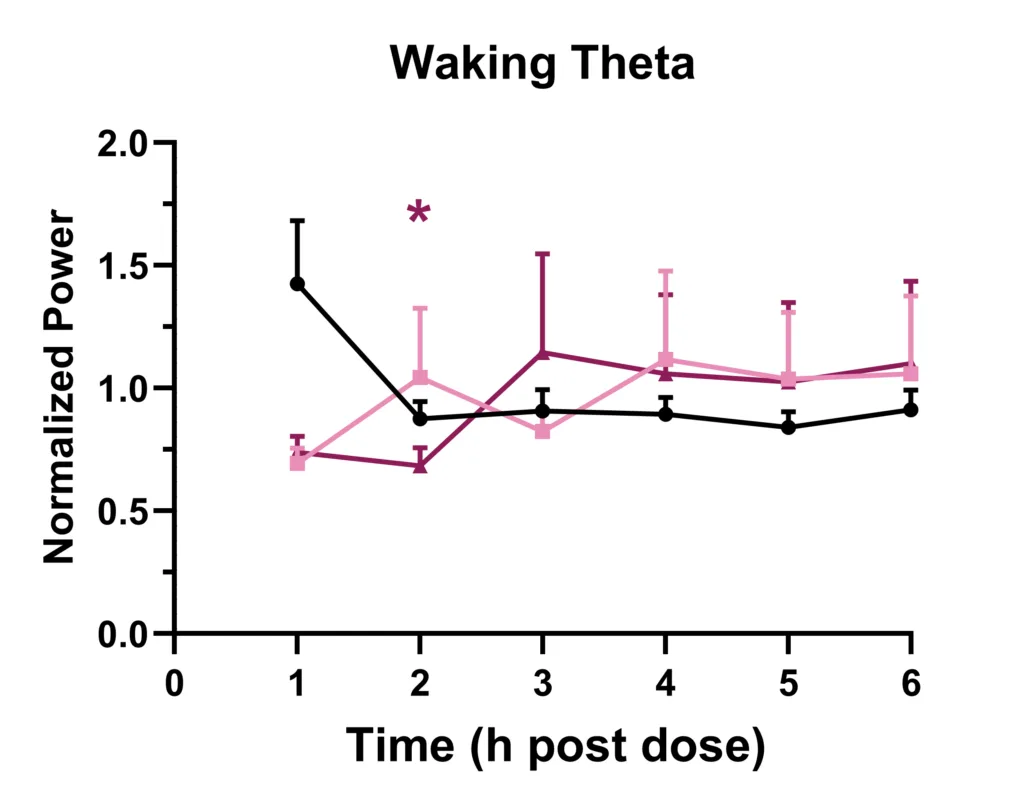
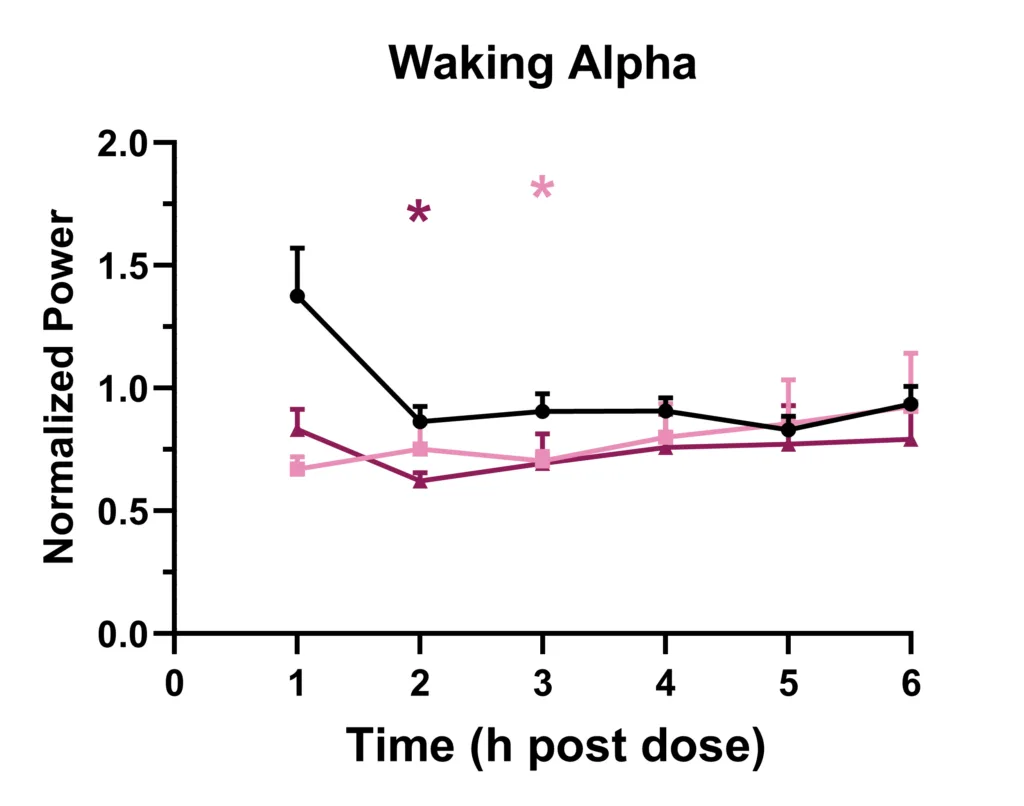
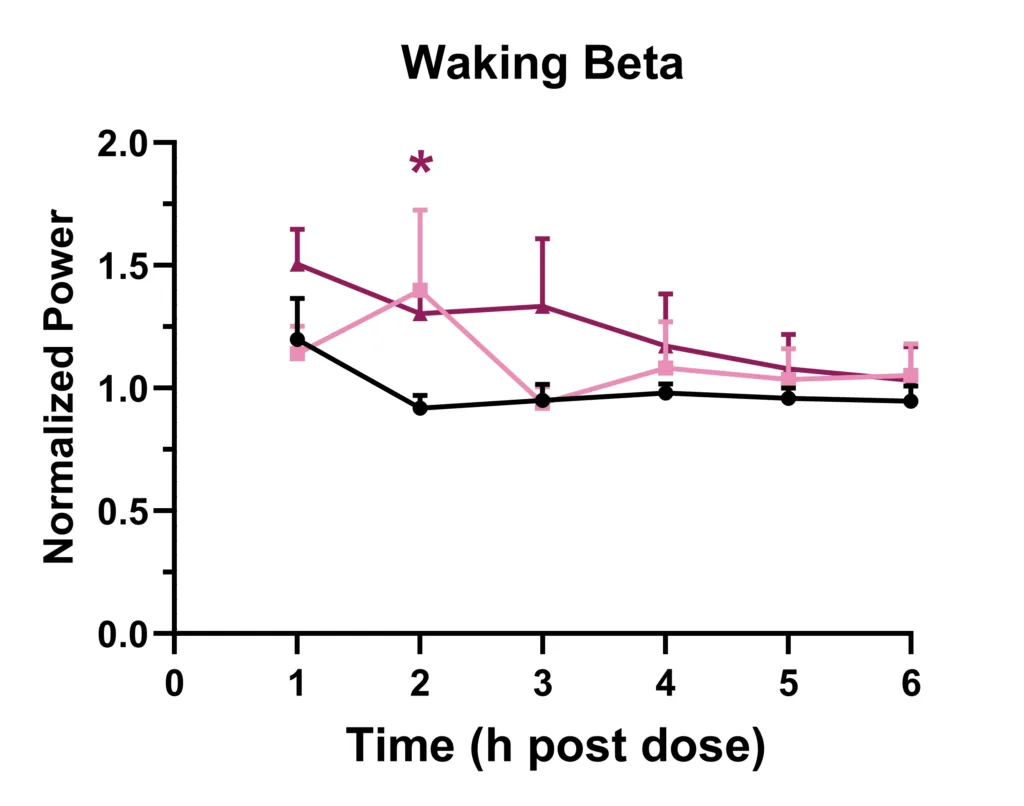
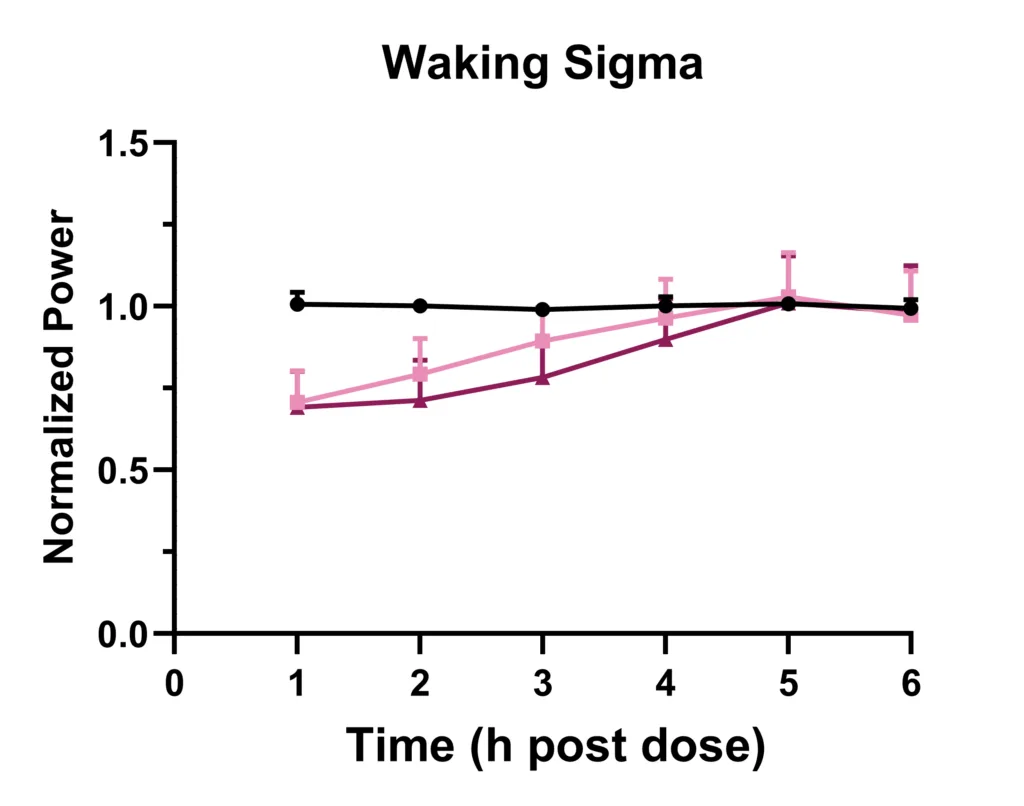
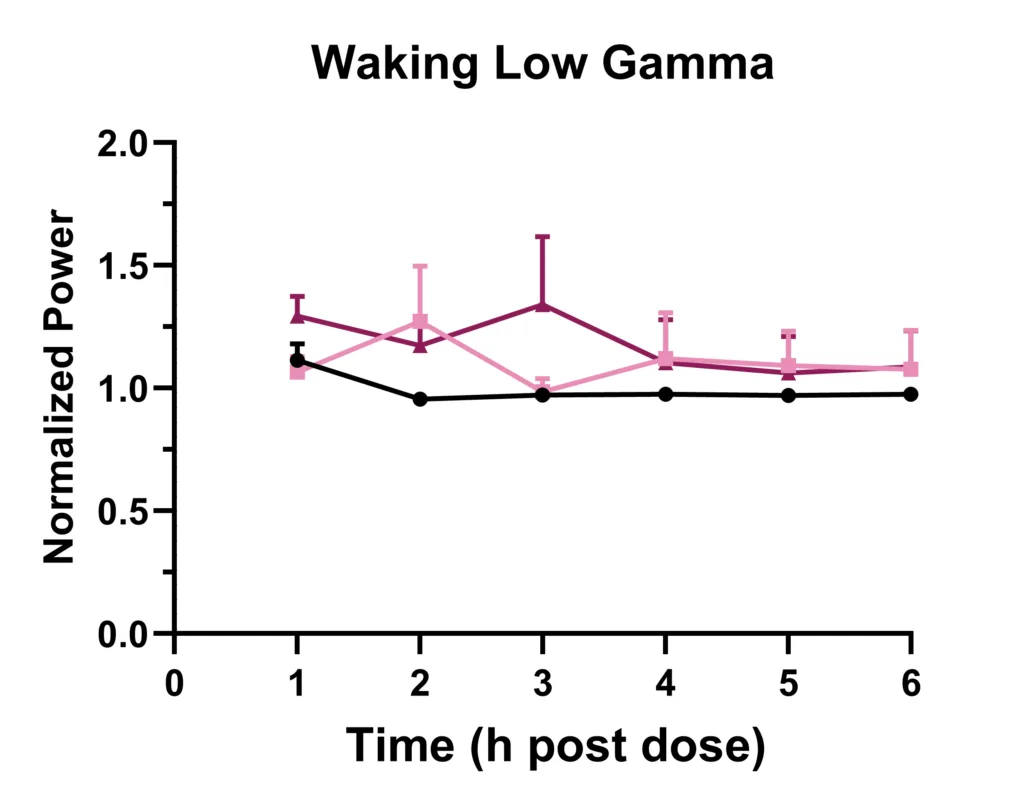
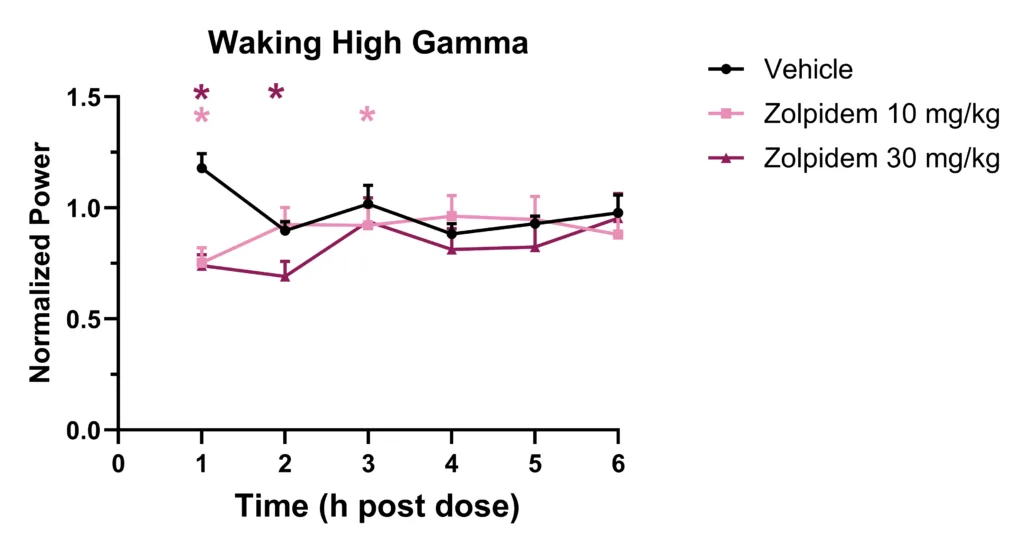
Figure 3. Hourly Wake and NREM power analysis following Zolpidem (10 and 30 mg/kg) in rats (n=10). Data is binned into the standard Greek frequency ranges of delta, theta, alpha, sigma, beta, low gamma, and high gamma. Analysis of the Wake spectrum following zolpidem (top set of panels) shows overall treatment effects of decreased power in alpha and sigma and increased power for beta, low gamma, and high gamma following the 30 mg/kg dose. Significant hourly data are designated by color-coded asterisk above the data points. These effects highlight changes in network function which could relate to the cognitive impairments found following zolpidem administration.
NREM EEG Spectral power
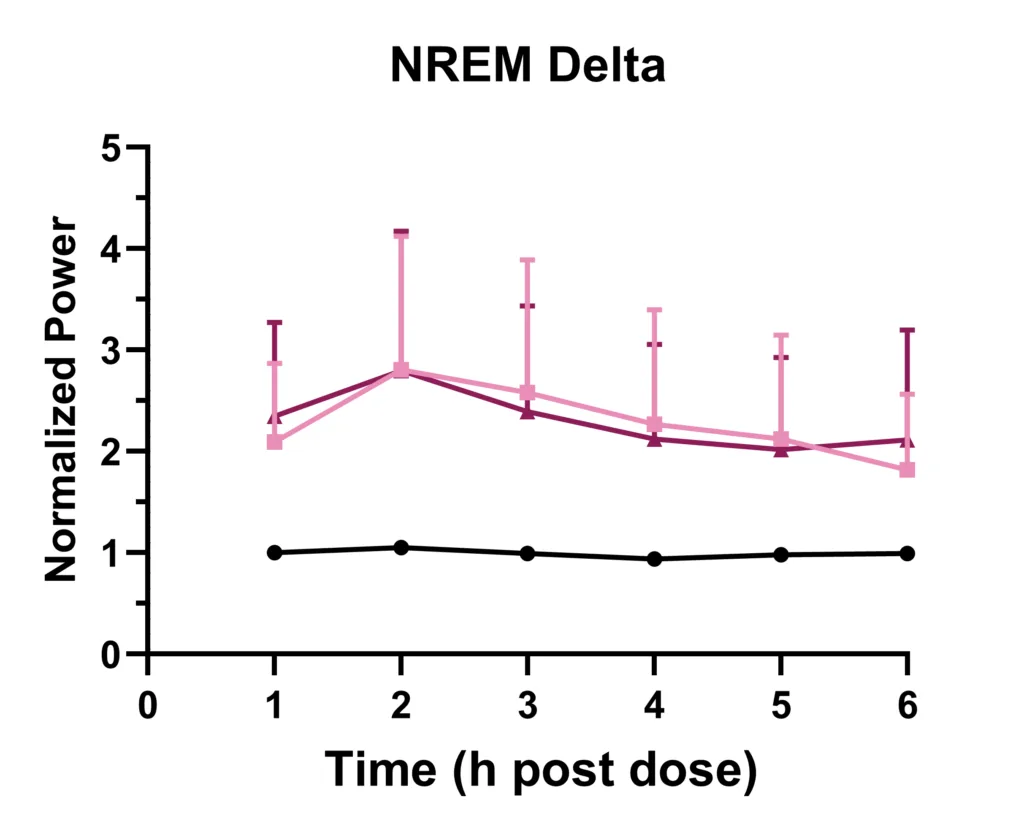
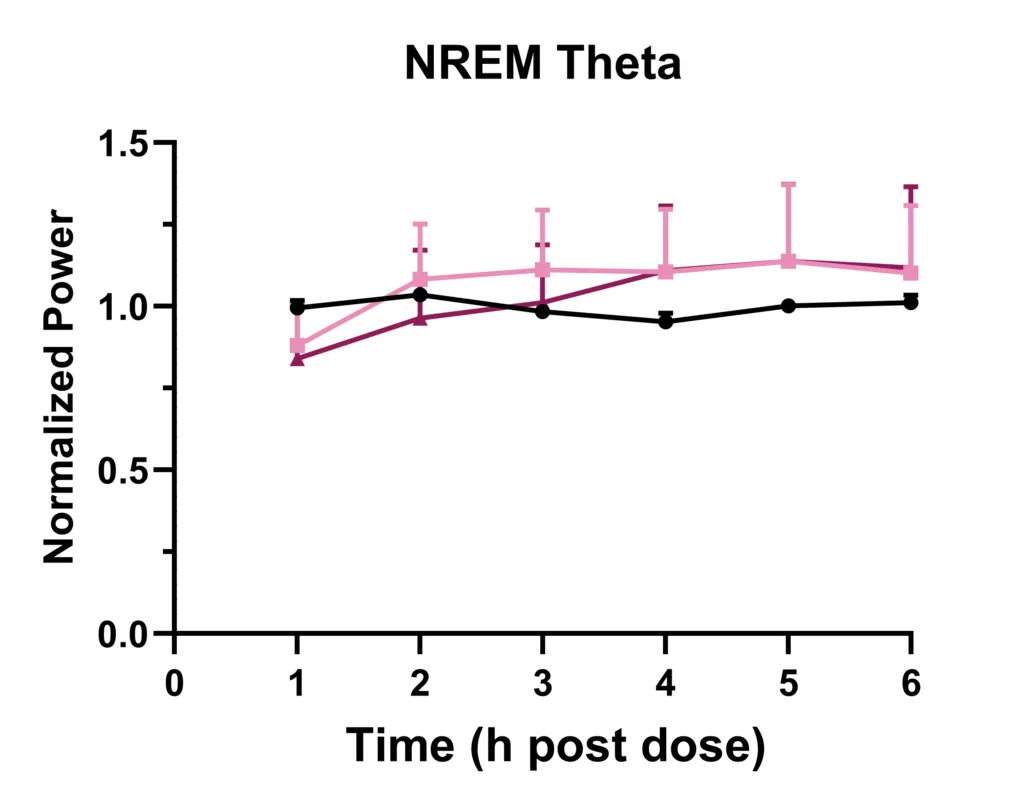

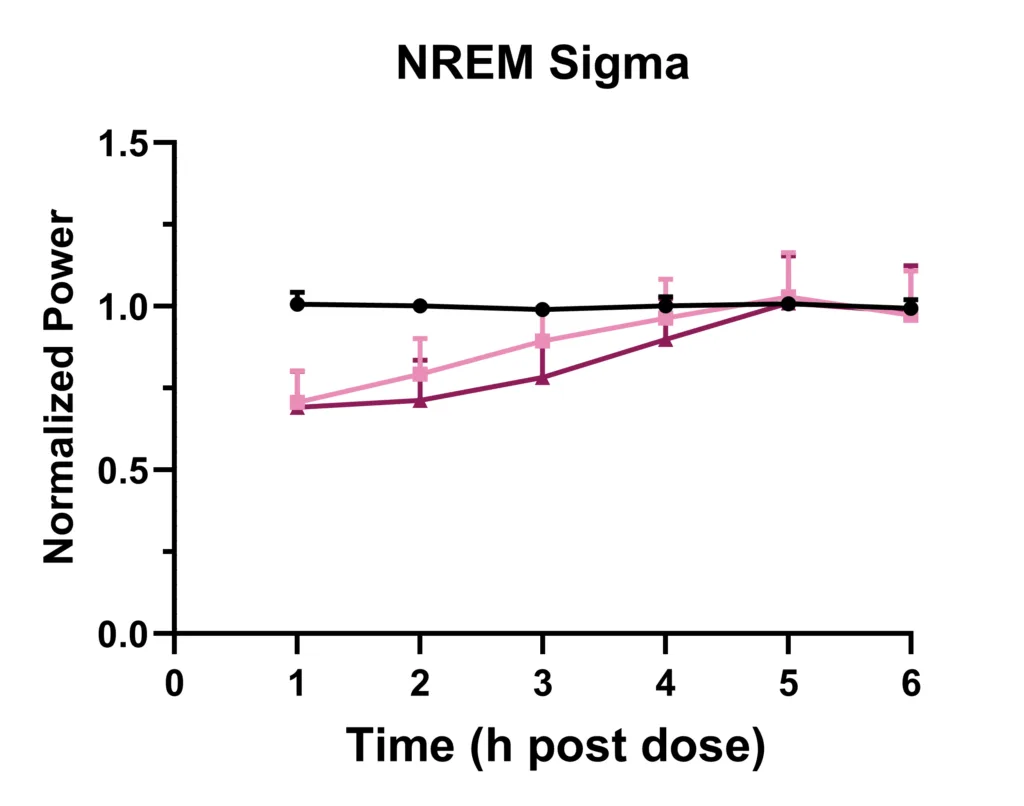
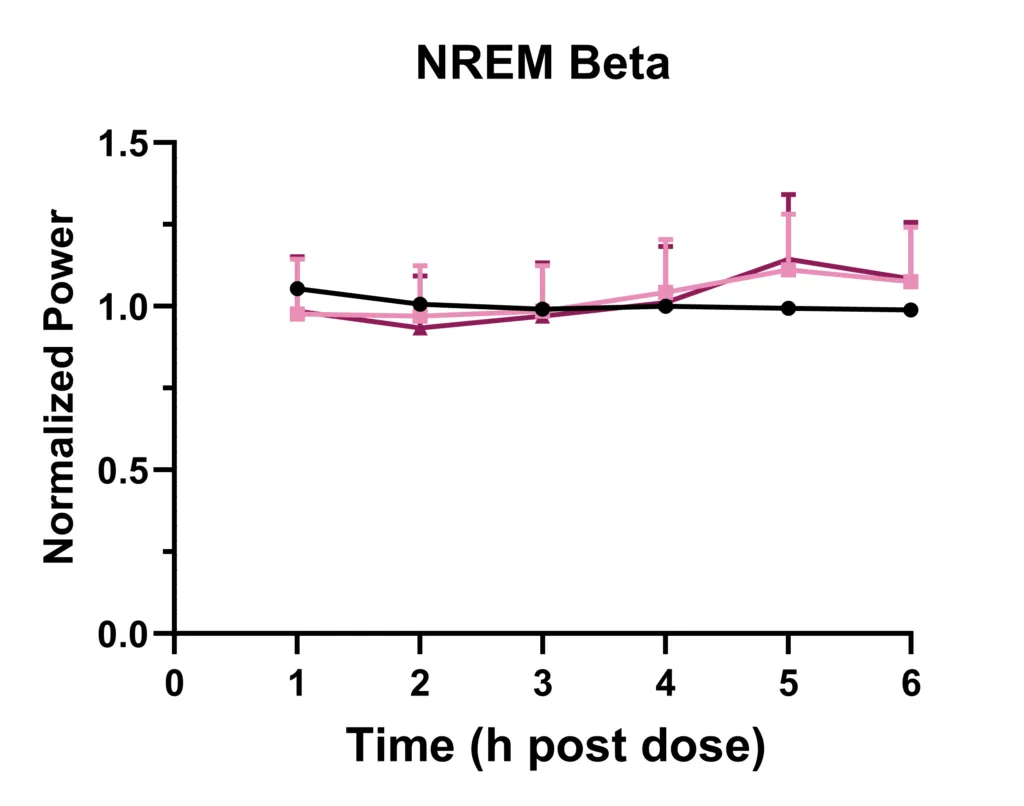
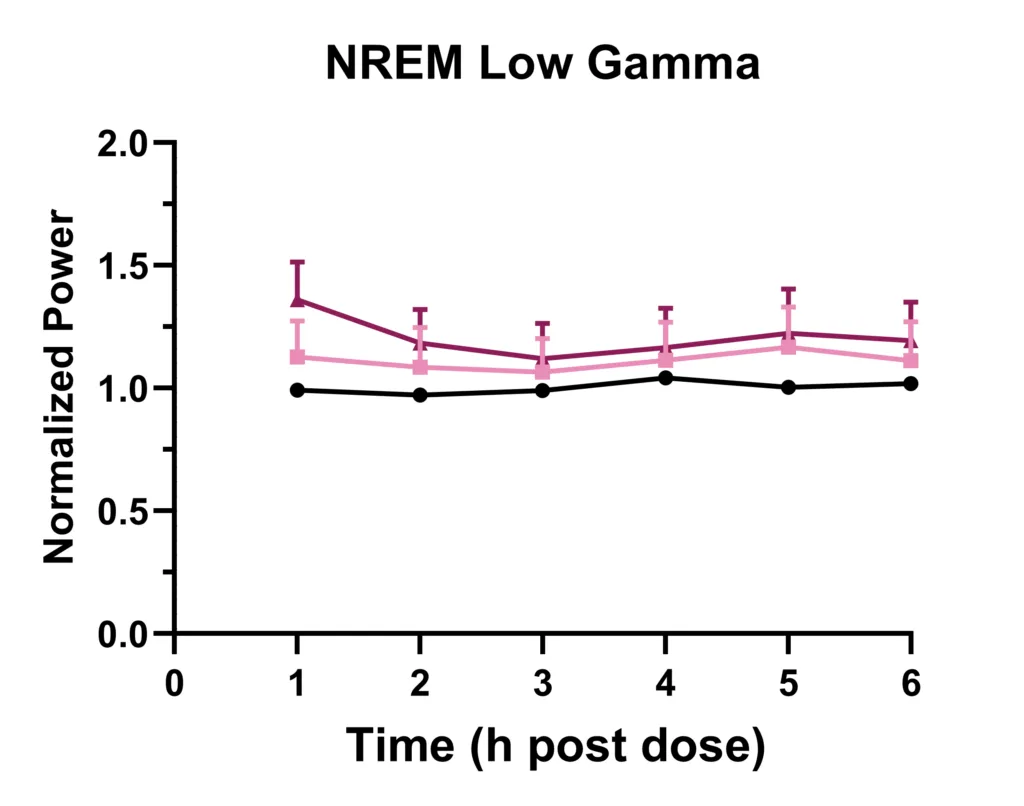
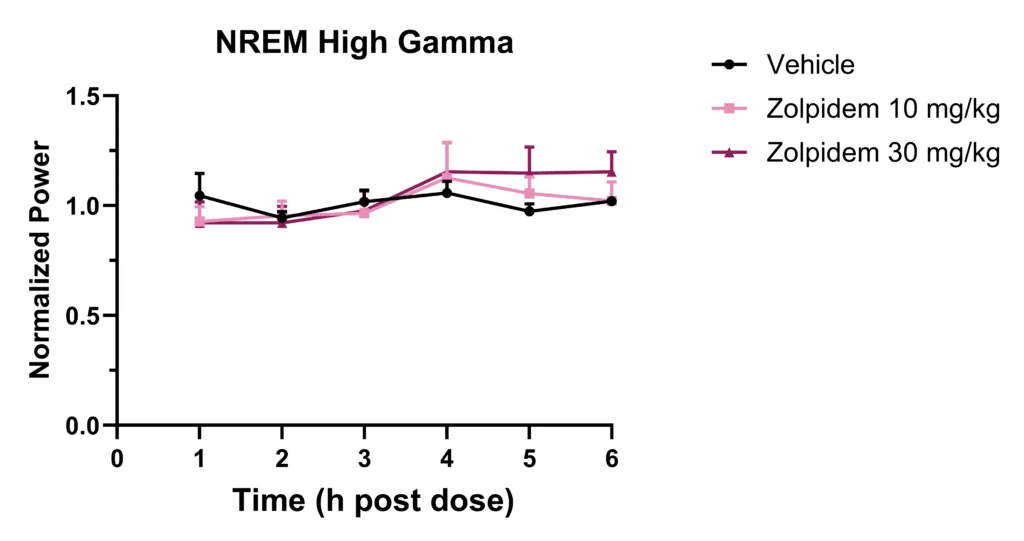
Figure 4. Analysis of the NREM spectrum following zolpidem shows overall treatment effects of increased power in delta and low gamma and decreased power for alpha and sigma mostly following the 30 mg/kg dose. Significant hourly data are designated by color-coded asterisk above the data points. These data suggest that the sleep experienced following zolpidem may not be physiologically the same as natural sleep.