ALS is a fatal neurological disorder characterized by progressive motor neuron degeneration resulting in muscle weakness, paralysis, and eventually death. Mutations of the superoxide dismutase 1 (SOD1) gene are linked to familial and sporadic cases of ALS. In collaboration with Taconic Biosciences, PsychoGenics characterized a SOD1 G93A (overexpressing rat model (SOD1 HMZ) of ALS (NTac:SD-Tg (SOD1G93A)L26H).
Health and Survival
SOD1 HMZ rats show a significant decline in body weight with disease progression and decreased survival compared to WT rats.
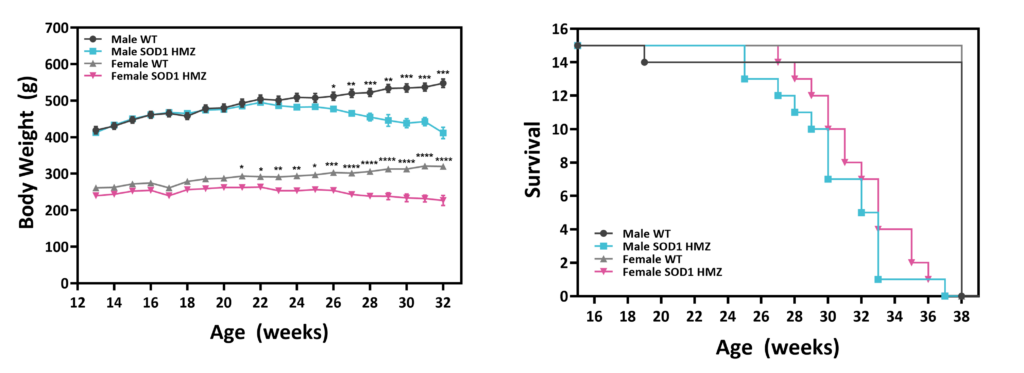
Figure 1: Time course for body weight (left) and survival (right) in SOD1 HMZ and WT rats.
Grip Strength (GS)
SOD1 HMZ rats show a significant decline in hindlimb GS starting at 17 weeks of age. Similarly, male SOD1 HMZ rats show deficits in forelimb GS compared to WT rats. The effects were more prominent in male rats compared to female rats.
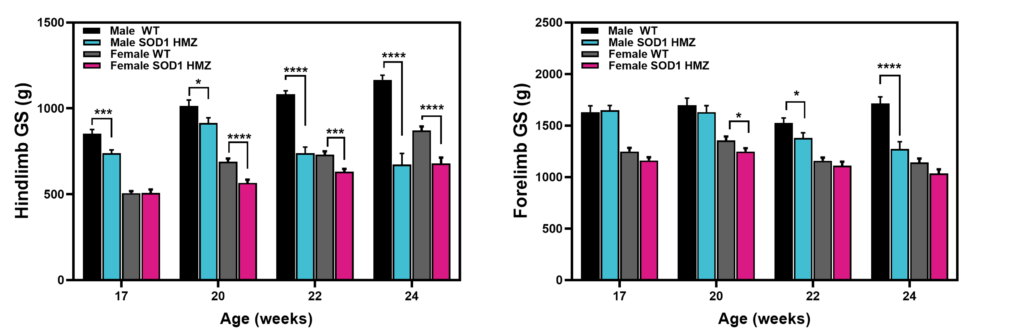
Figure 2: Time course for hindlimb (left) and forelimb (right) GS in SOD1 HMZ and WT rats.
Compound Muscle Action Potential
Compound muscle action potential (CMAP) is used to quantify disease progression in muscles that are impacted by motor neuron disease. Decrease in CMAP amplitude suggests loss of motor axons and is a clinically relevant measure in ALS patients.
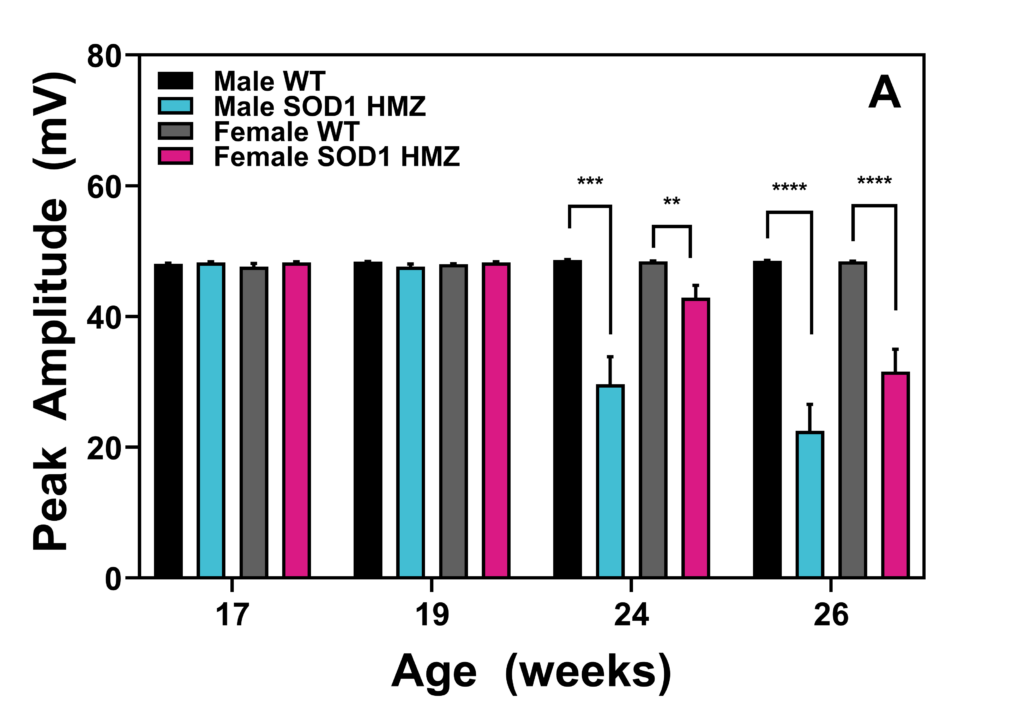
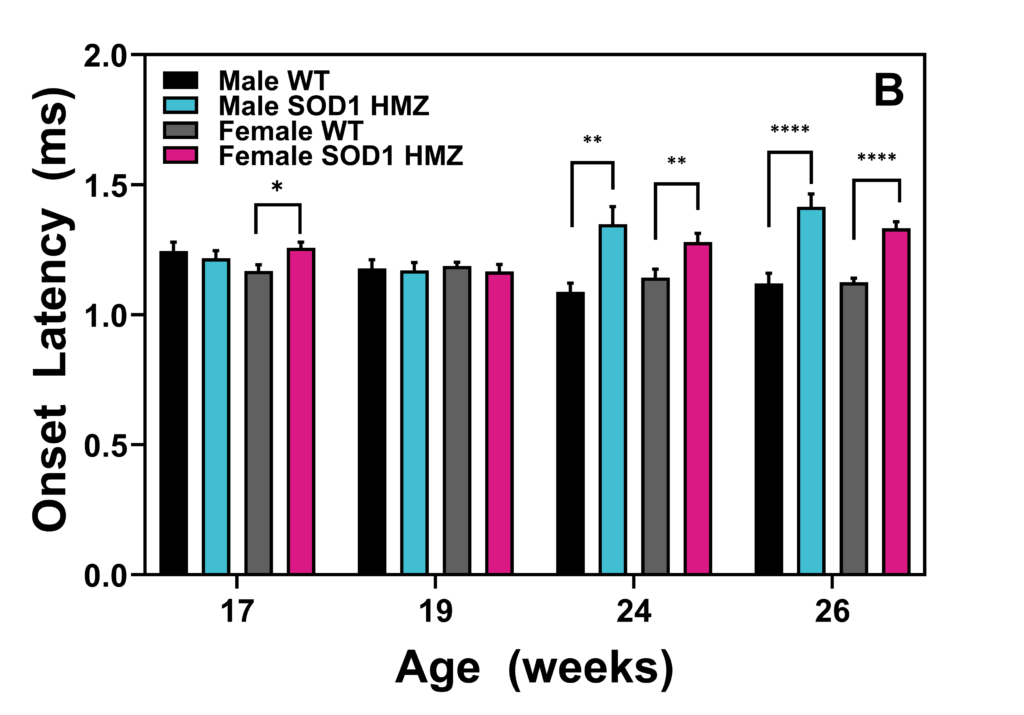
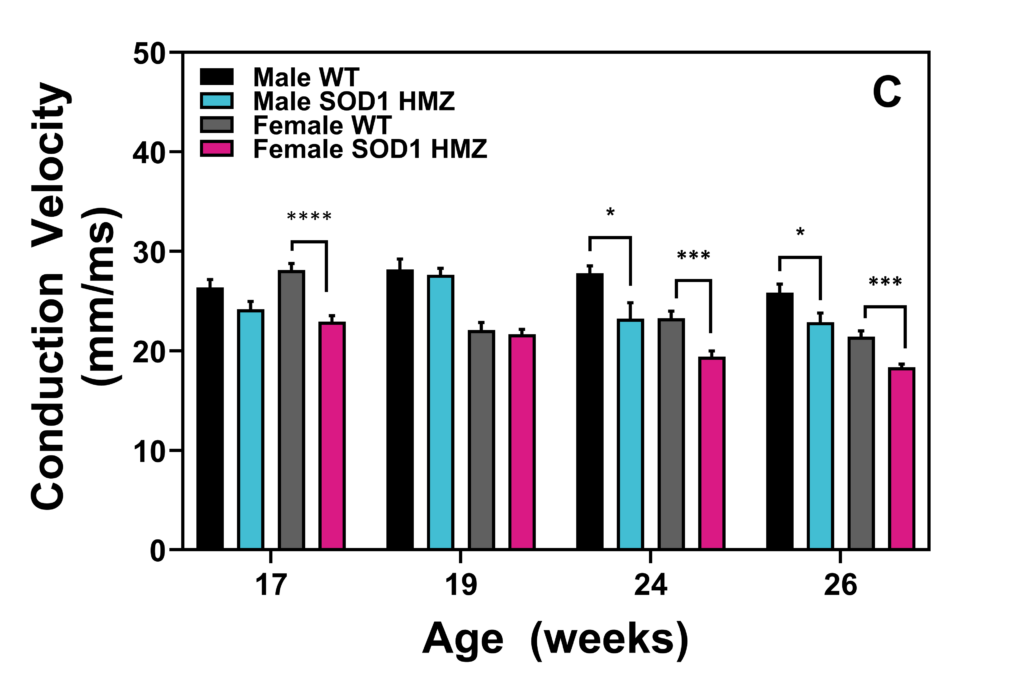
Figure 3: Time course for CMAP responses in gastrocnemius muscle recorded from male and female WT and SOD1 rats following sciatic motor nerve stimulation. (A) Peak response amplitude was significantly reduced in SOD1 HMZ rats compared to WT rats starting at 24 weeks of age, reflecting a dramatic loss of muscle mass. (B) Response latency was significantly impaired in SOD1 HMZ rats compared to WT rats. (C) Neuromuscular conduction velocity was slower in SOD1 HMZ rats compared to WT rats.
Neurofilament-light chain protein (NF-L)
NF-L is a validated biomarker for assessing disease progression, intensity, and treatment response across a wide range of neurodegenerative disorders including ALS. SOD1 HMZ rats have a significant increase in plasma and CSF NF-L levels.
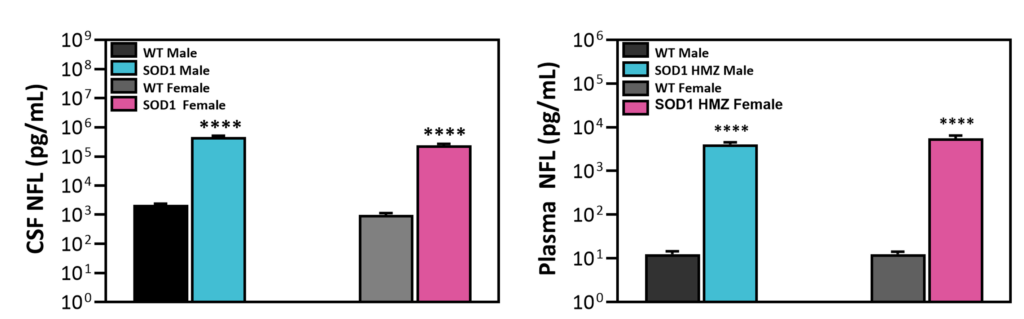
Figure 4: NF-L levels were significantly increased in CSF (left) and plasma (right) in 31-week old SOD1 HMZ and WT mice show.
Immunohistochemistry
SOD1 HMZ rats show increased astrogliosis and microgliosis in cervical, thoracic and lumbar spinal cord regions.
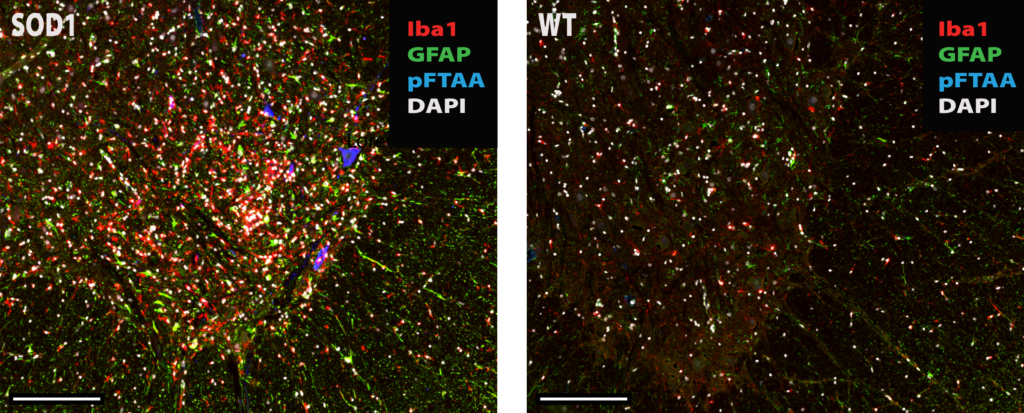
Figure 5: Representative images of cervical spinal cord from a SOD1 HMZ (left) and WT rat (right). SOD1 HMZ rats exhibit significant increases in inflammatory markers, Iba1 (red) and GFAP (green). The amyloid marker pFTAA (blue) shows solid aggregates in the cytoplasm of large motor neurons, neurites, and also some glial cells.
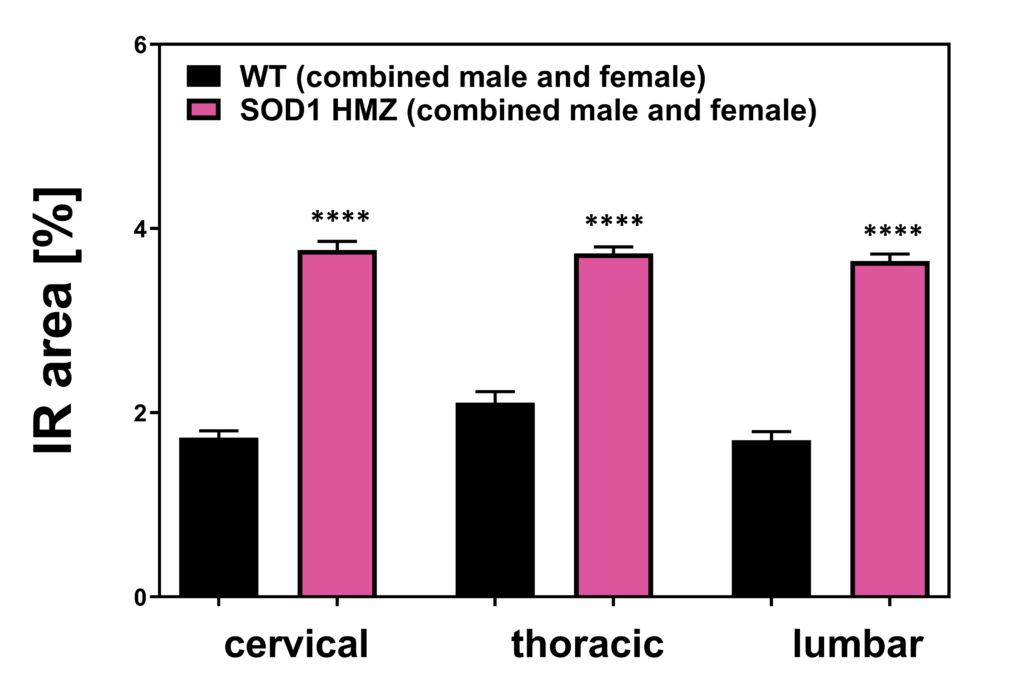
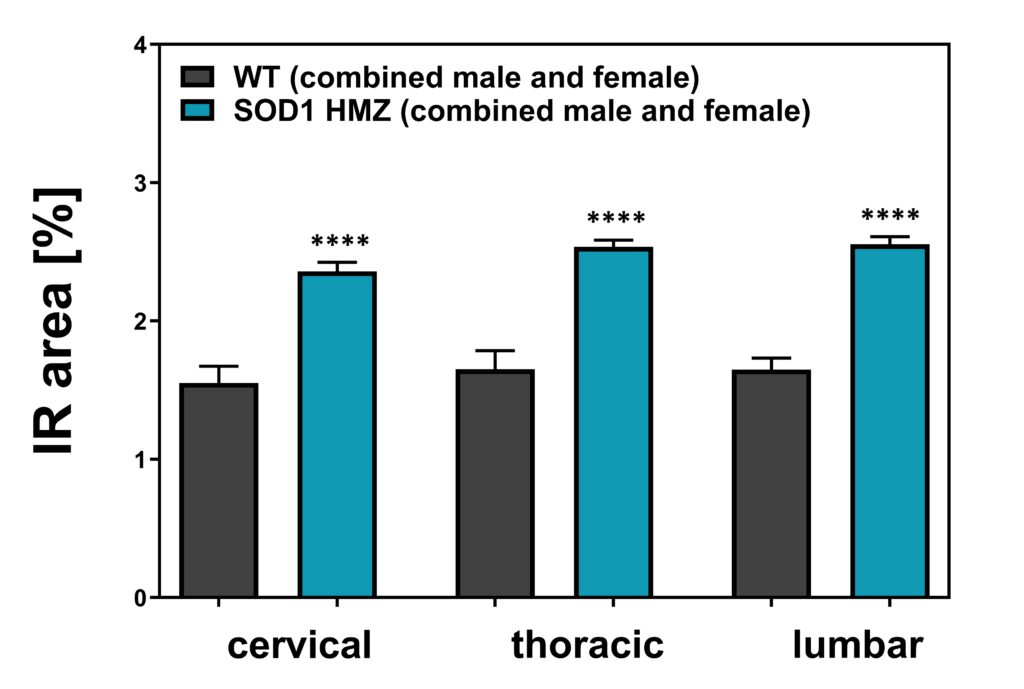
Figure 6: Increased microgliosis (left) and astrogliosis (right) in SOD1 HMZ rats compared to WT rats as seen by increased Iba1 and GFAP immunoreactive areas in cervical, thoracic and lumbar spinal cord, respectively.